A Guide to Backgrounds for Thumbnails That Drive Views
Discover how to design backgrounds for thumbnails that boost clicks. Learn design rules, color psychology, and optimization tips to increase your CTR.
Learn More
5 min read
February 3, 2026
Boost your CTR with this guide to YouTube thumbnail A/B testing. Learn how to plan, run, and analyze tests to get more views and grow your channel.

Written by:
If you've ever felt like you're just guessing what makes a great YouTube thumbnail, you're not alone. For years, creators have thrown designs at the wall to see what sticks. But what if you could know, with certainty, which thumbnail will get you more clicks?
That’s exactly what A/B testing is for. It's a simple but powerful idea: show different thumbnail designs to different slices of your audience and let the data tell you which one performs best. This isn't just about tweaking colors; it's a systematic way to boost your video's click-through rate (CTR) and, ultimately, your channel's growth.
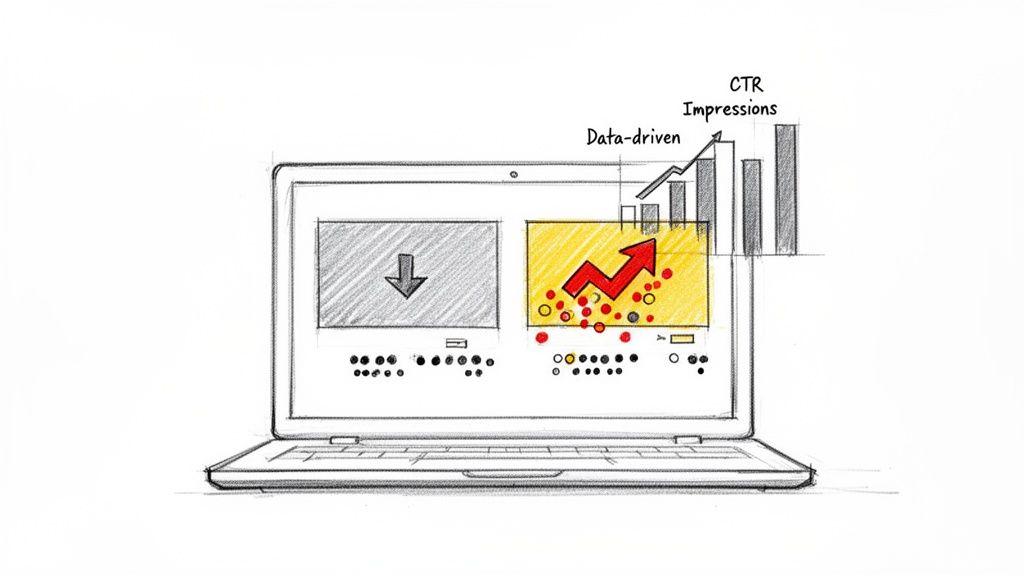
On YouTube, you have about two seconds to convince someone to click on your video instead of the ten others surrounding it. Your thumbnail is your best (and often only) shot. This is why YouTube thumbnail A/B testing has gone from a nice-to-have for top-tier creators to an absolute must for anyone serious about growing an audience.
Relying on data instead of just your gut isn't a luxury anymore; it's how you stay competitive.
We've all been there: staring at two thumbnail options, asking friends which one they like more. While that's better than nothing, it’s not data. An optimized thumbnail doesn't just look good; it communicates value and sparks curiosity, which gets you the click.
And that click sends a massive signal to the YouTube algorithm. A higher click-through rate (CTR) tells YouTube that your video is hitting the mark with viewers. In response, the algorithm pushes it out to more people. This kicks off a powerful growth loop: more clicks lead to more impressions, which leads to even more clicks.
A/B testing isn't just a technical task. Think of it as a creative tool for having a direct conversation with your audience. You're asking them, "Which of these makes you want to watch?" and getting a clear, data-backed answer.
This is how you figure out what your audience truly wants. For example, a gaming channel might find that a thumbnail showing a high-octane action scene gets twice the clicks compared to one with a simple character portrait. A cooking channel might learn that adding a bold, yellow text overlay boosts views by 30%. These aren't minor tweaks; they're foundational insights that can shape your entire visual strategy.
So, where do you start? Focusing on a few key elements can give you the biggest wins right away.
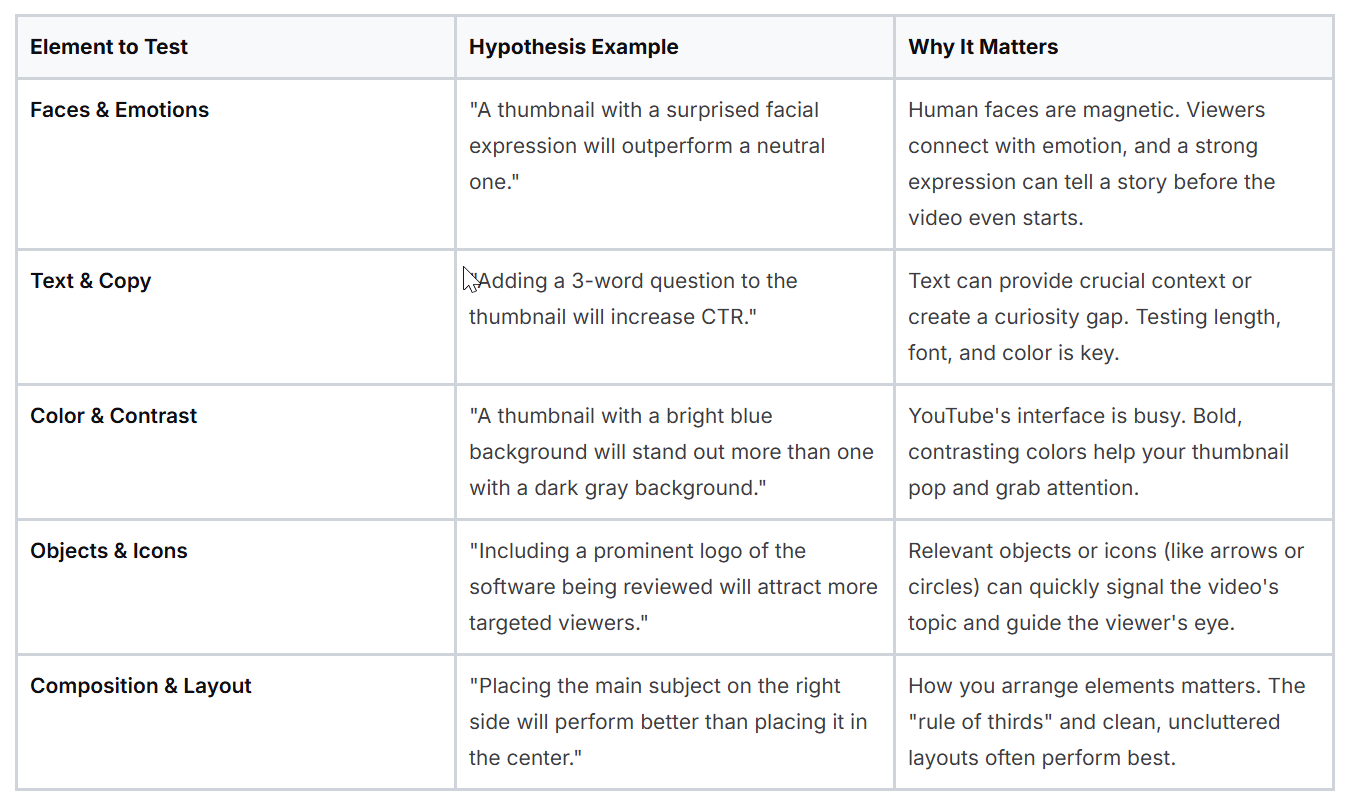
Testing these elements systematically will help you build a library of what works for your specific niche and audience, moving you from guesswork to a predictable growth strategy.
For a long time, the only way to A/B test thumbnails was with third-party tools. They were helpful but often felt clunky and disconnected from YouTube's own analytics. The creator community was loud and clear: we needed a built-in solution.
YouTube listened. In June 2023, they officially announced their native A/B testing feature, calling it 'Test & Compare.' It started with a small group of creators and then expanded rapidly. By mid-year, tens of thousands had access, and by July of the following year, an estimated 50,000 channels could test up to three thumbnail variations right inside YouTube Studio. You can read more about the impact of YouTube's native A/B testing tool on oonalab.ai.
This move was huge. It legitimized thumbnail testing as a fundamental part of the YouTube workflow. Now, you don't have to wonder what works; you can find out for sure.
Great A/B tests don't start by just throwing random designs at the wall to see what sticks. They start with a smart, focused question. If you want results that actually teach you something about your audience, you have to move beyond generic advice like "try a different color." The real goal is to form a specific, measurable hypothesis that gives you genuine insights.
Instead of just guessing, you need a clear statement about what you expect to happen and why. This simple shift turns testing from a lottery into a more scientific process. And when you do that, every test, win or lose, builds your understanding of what makes people click.
A strong hypothesis isn't complicated. It’s a simple "if-then" statement that isolates one specific change. For instance, a vague idea might be, "Let's make the thumbnail more exciting." That’s impossible to measure and gives a designer zero direction.
A sharp, testable hypothesis, on the other hand, is crystal clear:
Hypothesis: "If we swap our standard branded graphic for a thumbnail showing a human face with a surprised expression, then our click-through rate (CTR) for podcast clips will go up, because human emotion is more engaging than a static logo."
See the difference? This statement is specific, measurable, and explains the why behind the test. It clearly identifies the variable (human face vs. branded graphic), the metric (CTR), and the psychological principle you're testing (emotion). This clarity is what makes your results easy to understand and act on.
Great testing ideas don't come from thin air. They come from observation and a bit of detective work. You need to gather intel from three key places to inform your experiments.
Here are a few powerful triggers to build hypotheses around:
This is the golden rule of A/B testing: change only one thing at a time. It’s tempting to overhaul a thumbnail completely, but if you test a new background, new text, and a different facial expression all at once, your results will be meaningless.
Was it the bright red background? The funny expression? The shorter text? You'll never know for sure. To get clean, reliable data, you have to isolate your variables. If you want to test the text, keep the image identical. If you're testing an image, keep the text and branding the same. It's a more disciplined approach, sure, but the insights you gain are far more valuable and can be applied to future videos with confidence.
Alright, you've got a killer hypothesis. Now it's time to turn that idea into a real, live experiment where the clicks and views start rolling in. Getting a test up and running is pretty straightforward, and you have a couple of solid options: using YouTube’s own built-in tool or bringing in a specialized third-party app.
Both get the job done, but they work a bit differently. Let's walk through how to set up your A/B test, starting with the one right inside YouTube Studio.
When you upload a new video, you’ll find the 'Test & Compare' option right below where you'd normally add your thumbnail. YouTube built this to be dead simple and fit right into your publishing workflow.
Here’s the basic rundown:
This focus on watch time share is what makes the native tool so smart. It’s not just about which thumbnail gets the most clicks; it’s about which one leads to people actually watching more of your video. This is a brilliant way to weed out clickbait because a misleading thumbnail might spike your CTR but kill your watch time when disappointed viewers leave immediately.
Of course, it’s not perfect. The native tool only works for new uploads, meaning you can't go back and optimize your older videos. The test duration is also fixed, which isn't always ideal.
While YouTube's tool is great for new content, sometimes you need more control. That’s where third-party platforms like TubeBuddy or VidIQ come in. These tools plug into your channel through YouTube’s API and offer a completely different way to A/B test.
They bring some serious advantages to the table:
The setup is a little different, though. Instead of showing different thumbnails to different people at the same time, these tools usually rotate thumbnails on the live video itself, often every 24 hours. They then compare the CTR from each period to see which one performed best.
My Takeaway: Your choice really comes down to your goal. If you want to maximize watch time on a brand-new video, stick with YouTube's 'Test & Compare'. But if you want to boost the CTR on an older video or need more control over the test, a third-party tool is the way to go.
To help you decide which path is right for you, here’s a quick head-to-head comparison of their core features.
FeatureYouTube 'Test & Compare'Third-Party Tools (e.g., TubeBuddy)Video EligibilityNew uploads onlyAny video (new or old)Primary MetricWatch Time ShareClick-Through Rate (CTR)Test DurationUp to 14 days (automatic)Flexible (you decide when to end it)Number of VariantsUp to 3 (A/B/C)Usually 2 (A/B), sometimes moreAudience SplittingSimultaneous (different users see different thumbnails)Sequential (all users see one thumbnail at a time)Ease of UseVery simple, integrated into upload flowRequires external setup, but offers more control
Ultimately, there’s no single "best" option. Many experienced creators use YouTube's tool for new uploads and a third-party tool to continuously optimize their back catalog.
Thinking about how this all fits together, from your initial idea to the final test, can be visualized pretty simply.
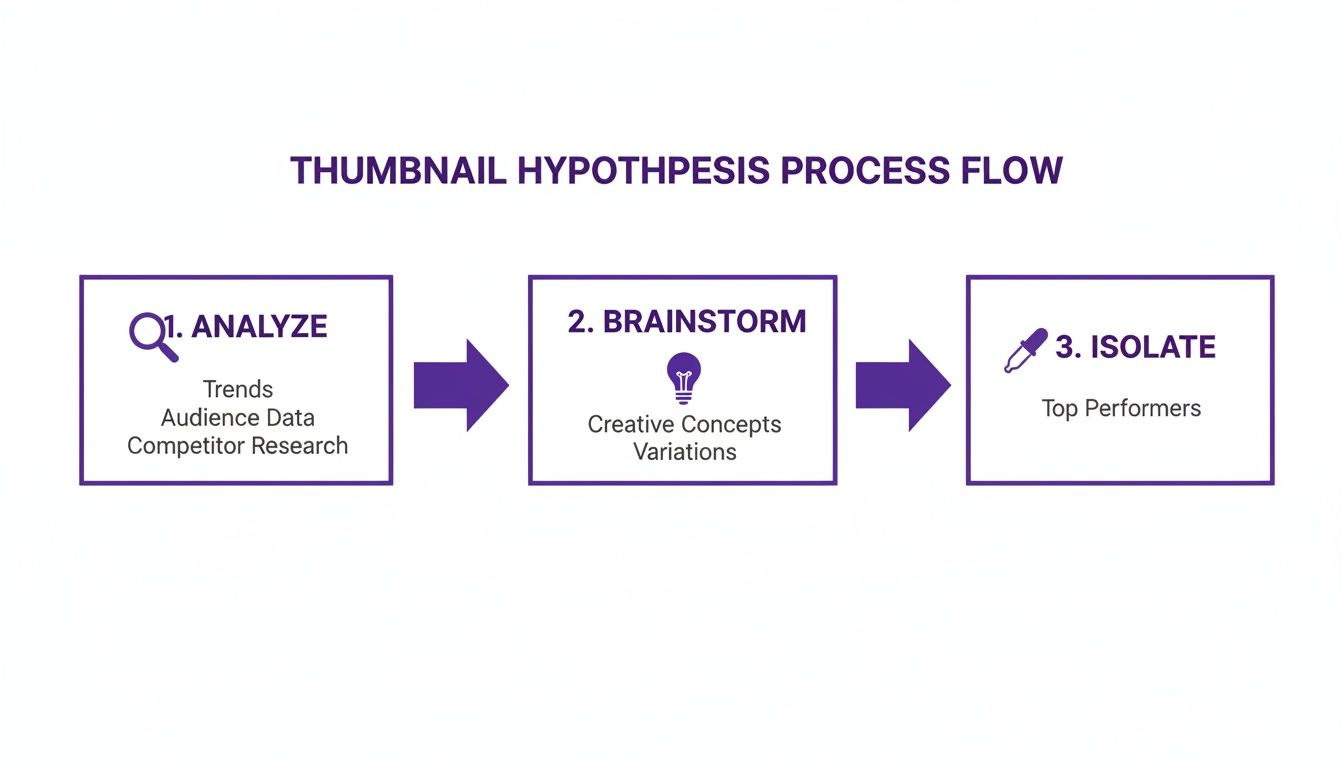
This loop of analyzing, brainstorming, and isolating what works is the engine that drives every single successful A/B test.
Let's be real: making two or three distinct, high-quality thumbnails for every single video can feel like a chore. Thankfully, you don't have to do it all by hand anymore.
Modern tools are built to make this process much faster. Some platforms now use AI to instantly generate a handful of unique thumbnail ideas based on your video's content. You can learn more about how to create AI-generated thumbnails to fuel your tests without spending hours in a design program.
This completely changes the game. You can go straight from uploading your video to launching a test, skipping the manual design bottleneck. It makes consistent A/B testing a real, manageable part of your strategy, not just something you do "when you have time."
Running the test is the easy part. The real skill, the thing that separates creators who get lucky once from those who build a repeatable system for growth, is knowing how to read the story the data is telling you.
Making a confident call requires looking beyond just one number. You’re not just trying to figure out what happened, but why it happened. That’s how you turn a single test into a lesson you can apply to every video you make from now on.
It’s so tempting to see a higher click-through rate (CTR), declare a winner, and call it a day. But hold on. CTR only tells you who clicked, not how long they stuck around. A flashy, clickbait-style thumbnail might get tons of initial clicks, but if it misleads people, they'll leave immediately. That's a bad signal for the algorithm.
This is exactly why experienced creators look at the bigger picture. A great thumbnail doesn’t just earn a click; it delivers on its promise and keeps people watching.
To get the full story, you need to look at these metrics together:
The magic happens when you compare CTR and watch time. If one thumbnail wins on both, you have a clear champion. But if one has a lower CTR and a higher watch time share? That’s often the smarter choice for your channel's long-term health.
The YouTube algorithm has one primary goal: keep people on the platform. That's why its 'Test & Compare' feature is built around watch time share, not just raw clicks. A click that leads to someone leaving your video in the first 10 seconds is actually a negative signal.
When YouTube’s Test & Compare feature launched, it completely changed the game. It measures success by which thumbnail generates more total watch time, because that's what truly signals viewer value to the algorithm. Over its two-week test window, YouTube shows up to three thumbnails to different viewer groups, then divides up the total watch time. If Thumbnail A brings in 30% of the watch time and Thumbnail B brings in 70%, YouTube automatically crowns B the winner.
This is a much better metric than CTR alone. A thumbnail that drives just 10% more watch time share can give you a massive boost in algorithmic recommendations, often leading to a 20-50% indirect increase in CTR down the line. To see more on this, check out the breakdown of how YouTube's testing works on epidemicsound.com.
Let's walk through a common situation. You're testing two thumbnails for a tutorial video.
After a week, here are your results:
MetricThumbnail A ("Problem")Thumbnail B ("Solution")CTR6.2%5.5%Watch Time Share45%55%
At first glance, Thumbnail A’s 6.2% CTR looks better. But look closer. Thumbnail B drove 55% of the watch time. This tells a story: the "Problem" thumbnail got more people to click out of curiosity, but the "Solution" thumbnail attracted the right audience, people who were genuinely interested and watched for much longer.
In this scenario, Thumbnail B is the undisputed winner. By choosing it, you're prioritizing audience satisfaction and sending powerful positive signals to the algorithm. A slightly lower CTR is a small price to pay for a much higher quality view. If you're comparing tools for this, our Taja vs TubeBuddy article explores how different platforms handle these metrics.
Before you pop the champagne, you need to make sure your result isn't just a fluke. Statistical significance is the term for this; it’s a measure of how confident you can be that the difference between your thumbnails is real and not just random chance.
Most A/B testing tools, including YouTube's, will signal when a result is statistically significant, usually at a 95% confidence level. If you stop a test too early without enough impressions, you risk making a decision based on noise. As a general rule, don't draw any firm conclusions until each thumbnail has at least a few thousand impressions.
Running A/B tests for your thumbnails is one of the smartest things you can do for your channel's growth. But I've seen a lot of creators get tripped up by the same few mistakes, which can turn good intentions into confusing, useless data.
Learning to spot these traps is just as crucial as setting up the test correctly. If you can build a trustworthy process, every single test, win or lose, teaches you something valuable for the next video. Let's walk through the most common errors I see and how you can steer clear of them.

This is probably the most tempting mistake to make. You have two totally different thumbnail ideas, so you test them against each other. One has a new background, different text, a new font, and a different photo of you. One of them wins, but you're left scratching your head.
What actually made the difference? Was it the bright yellow background? The question in the text? That surprised look on your face? You’ll never really know. This makes it impossible to apply what you think you learned to future thumbnails.
The fix here is simple but requires discipline: isolate a single variable. If you want to test text, keep every other element, the background, the branding, the core image, exactly the same. If you're testing an emotional expression, don't change the words. This is the only way to get clean, actionable data you can actually build on.
I get it. You launch a test, and a few hours later, one thumbnail is already crushing it with a 1.5% higher CTR. It’s exciting! The urge to declare a winner and lock in the better design is strong. But acting on that impulse is a huge mistake.
Early results are often just statistical noise. A test with only a few hundred impressions is completely unreliable. If you make a decision based on that tiny sample size, you could easily end up picking the worse thumbnail in the long run, kneecapping your video's potential.
Patience is a non-negotiable part of good A/B testing. You have to let the data mature before you can trust it. A test needs thousands of impressions per variation to reach what's called statistical significance.
Most testing tools will tell you when you've hit 95% confidence. Don't call it a day until you see that number. As a rule of thumb, let your test run for at least a full seven days to account for natural dips and spikes in viewership throughout the week.
Data-driven decisions need, well, data. If you try to run a thumbnail test on a video that only gets a trickle of views, you’re just spinning your wheels. The test will either run forever without a clear winner or spit out a result you can't trust.
Think about it: a video that gets fewer than a thousand impressions over the entire two-week testing window just doesn't have a big enough audience to produce a reliable outcome. You need a big enough sample size for the math to work.
So, how do you solve this? Focus your testing efforts where they'll actually count.
Don't waste your time testing on videos that don't have the viewership to give you a clear signal.
In the endless hunt for a higher CTR, it's easy to forget about your channel's identity. You might run a test and discover that a clickbaity thumbnail with giant red arrows and a ridiculous facial expression gets a short-term bump in clicks. But if that style is completely disconnected from your actual content, you're playing a dangerous game.
When a viewer clicks expecting a serious financial breakdown but gets a sensationalized vlog, they feel tricked. This mismatch destroys trust and can absolutely tank your audience retention and subscriber loyalty, metrics that are infinitely more valuable than a temporary CTR win.
The real goal is to find that perfect balance between grabbing attention and being true to your brand. Use A/B testing to refine your signature style, not abandon it. Test subtle variations of your branded look to discover what resonates best with your audience without alienating them.
Even with a solid plan, you're bound to run into some practical questions once you start running thumbnail tests. Getting these details right can be the difference between a confusing result and a clear winner.
Let's clear up some of the most common questions creators have when they dive in.
The answer isn't about the clock; it's about traffic. While YouTube's built-in tool runs for up to 14 days, your real goal is to get enough data. Each thumbnail variation needs to rack up thousands of impressions before you can trust what you're seeing.
If a video blows up right out of the gate, you might get a confident winner in just a couple of days. But for most videos, especially evergreen content, you’ll want to let it run for at least a week, if not the full two. This helps smooth out any weird fluctuations between weekday and weekend viewing habits.
The single biggest mistake is calling a test too early. Those first few hundred impressions can be incredibly misleading. Always wait for your tool to declare a statistically confident winner before you make the final call.
This is a huge point of confusion and highlights a key difference between testing tools. If you're using YouTube's native 'Test & Compare' feature, the answer is a hard no. It only works for new videos at the moment you upload them. You can't go back and run a test on something that's already live.
This is exactly why third-party tools like TubeBuddy or VidIQ are so popular. They are specifically designed to let you test thumbnails on any video in your library, old or new. This is an absolute game-changer for breathing new life into your back catalog. Swapping in a fresh, high-performing thumbnail on an old evergreen video can reignite its CTR and kickstart a whole new wave of views.
Trying to find a single "good" CTR is a fool's errand. There’s no magic number. What's considered great is completely relative to your niche, your audience, and where your views are coming from (Browse Features traffic behaves differently than Search traffic, for example).
Generally speaking, most channels see an average CTR between 2% and 10%.
Forget comparing yourself to others. The real goal is to improve your own baseline. If your channel average is hovering around 3%, and a new thumbnail test lifts a video to 4.5%, that's a massive win. You've just found something that resonates better with your audience.
Focus on beating your last video. A/B testing is all about making small, continuous improvements that compound over time, steadily lifting your entire channel's performance.
Ready to stop guessing and start creating thumbnails that actually get clicks? With Thumbnail Maker, you can generate multiple high-quality, AI-powered designs in seconds, giving you perfect A/B test candidates instantly. Save time, eliminate the design work, and let data drive your growth. Try Thumbnail Maker for free and see the difference it makes for your channel.


Discover how to design backgrounds for thumbnails that boost clicks. Learn design rules, color psychology, and optimization tips to increase your CTR.
Learn how to make good YouTube thumbnails with this guide on design, psychology, and strategy. Boost your CTR and get more views with proven techniques.
Learn how adding chapters to YouTube video boosts views and SEO. Our guide covers everything from manual timestamps to AI tools for creators.